With a dozen servers, the state of the estate lives in an administrator’s head. With hundreds of them spread across providers, hypervisors and containers, infrastructure fleet management stops being a tooling problem and becomes a credibility problem: how do you know the backup is actually running, and the firewall rule is actually in force?
The core principle: the verdict comes from a probe, not a person
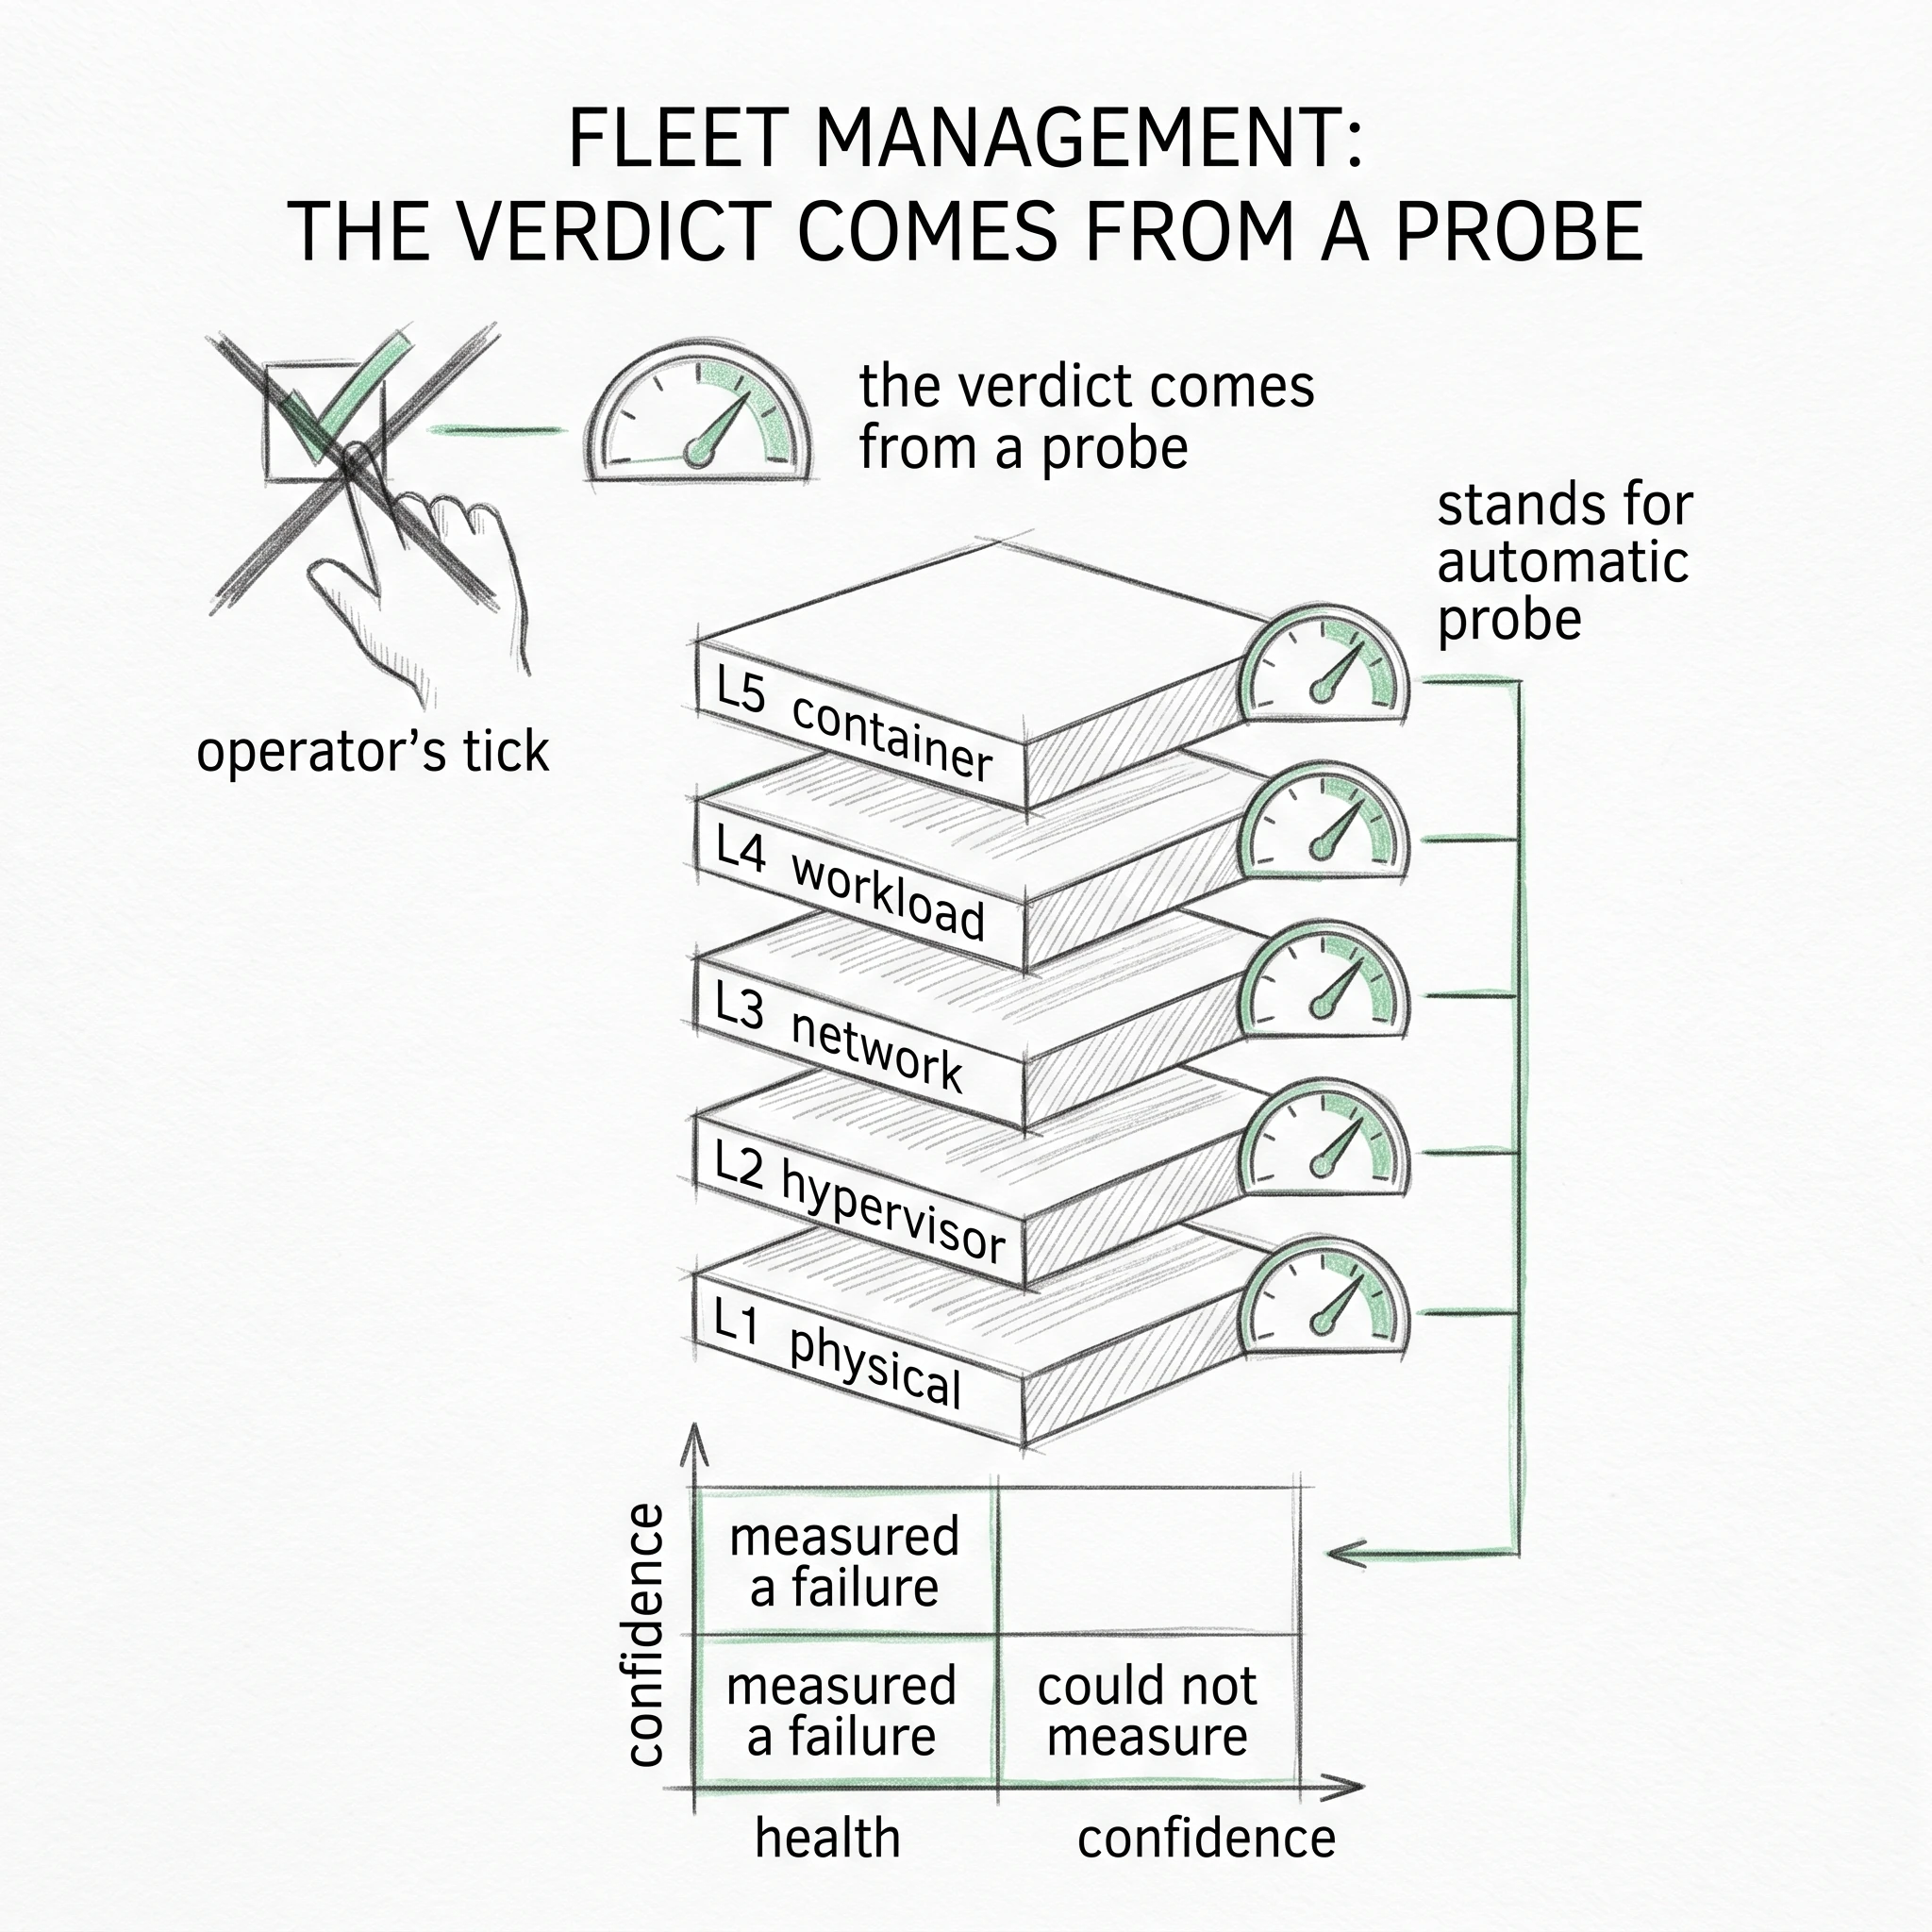
In classic infrastructure fleet management a node state is whatever the operator said it was. They looked, ticked a box, moved on. The trouble is that a tick reflects the state of a person’s attention at that moment, not the state of the system.
So every verdict, whether availability, backup, certificates, firewall rules, licences or incidents, is computed by an automatic probe. And work cannot be declared done until the result is confirmed by a repeat measurement. That removes the most common source of divergence between documentation and reality.
Firewall and backup probes of this kind feed the SIEM layer of the information security service, where a verdict is again measured rather than declared.
Two axes instead of one: health and confidence
Ordinary monitoring thinks in one colour: green or red. But “could not measure” and “measured a failure” are entirely different situations, and they collapse into the same red.
The signal therefore has two axes: health separately, confidence in the measurement separately. A red status is set only on a genuinely measured fact. An unreachable probe is not a node outage, it is missing data, and it has to look different. Otherwise the person on duty gets used to red and stops reacting to it.
Five layers, each node on its own
- L1, physical: a bare-metal server at any provider.
- L2, hypervisor: the virtualisation host (VMware ESXi, Proxmox).
- L3, network: firewall and router (OPNsense, pfSense).
- L4, workload: a guest virtual machine or a service.
- L5, container: a Docker container, platform or customer owned.
In this model of infrastructure fleet management every node is bound to its layer and inherits the context of the ones beneath it. The practical point is simple: a failure is visible where it originated rather than where it surfaced. A dead container and a dead hypervisor under it are different events with different urgency, and confusing them is expensive.
What follows in practice
- Node passports are generated from live measurements: declared configuration against what was actually measured. Such a document does not go stale, because nobody writes it by hand.
- A view from outside. Open ports and services on managed addresses are checked externally and reconciled against the declared firewall policy. A divergence is highlighted immediately, and that is exactly the class of error invisible from inside.
- A backup coverage matrix: every machine must have a solution, and an uncovered machine fails the check. Not “we back up everything, probably”, but a list with no exceptions.
- Certificates are issued and renewed automatically through a DNS API, without port forwarding, with freshness monitored.
- The web interface is read-only. Control operations go through the CLI and modules. That is a deliberate restriction: a panel that can break everything in one click is itself a risk.
Honest limits
Infrastructure fleet management of this kind costs more up front. Writing a probe is harder than ticking a box, and the first weeks feel like a slowdown. It pays off later, when it turns out that part of what was “working” had not been working at all.
Second, automation does not replace the engineer. It removes routine checking and the innate tendency to see what one expects, but decisions on non-standard situations stay with a person. The access model all of this rests on is described in the piece on Zero Trust in practice.
Frequently Asked Questions
How is this different from monitoring? Monitoring answers whether a node is alive. Here each property gets its own verdict, and only from an automatic probe.
Why two axes? “Could not measure” and “measured a failure” are different; collapsed into one red, they train the duty engineer to ignore it.
Why look from outside? A stray open port is usually invisible from within, and an external reconciliation against firewall policy finds it.
Why read-only web? A panel that can break the fleet in one click is a risk in itself.
Need a Consultation?
If your fleet has grown to the point where nobody can say with confidence what runs where, book a free 15-minute call.